How to Read Your AI Visibility Score
A walkthrough of the Halogen Presence dashboard, covering what the visibility score actually measures, how the trend chart and competitor bars work, and what to look at first when you log in.

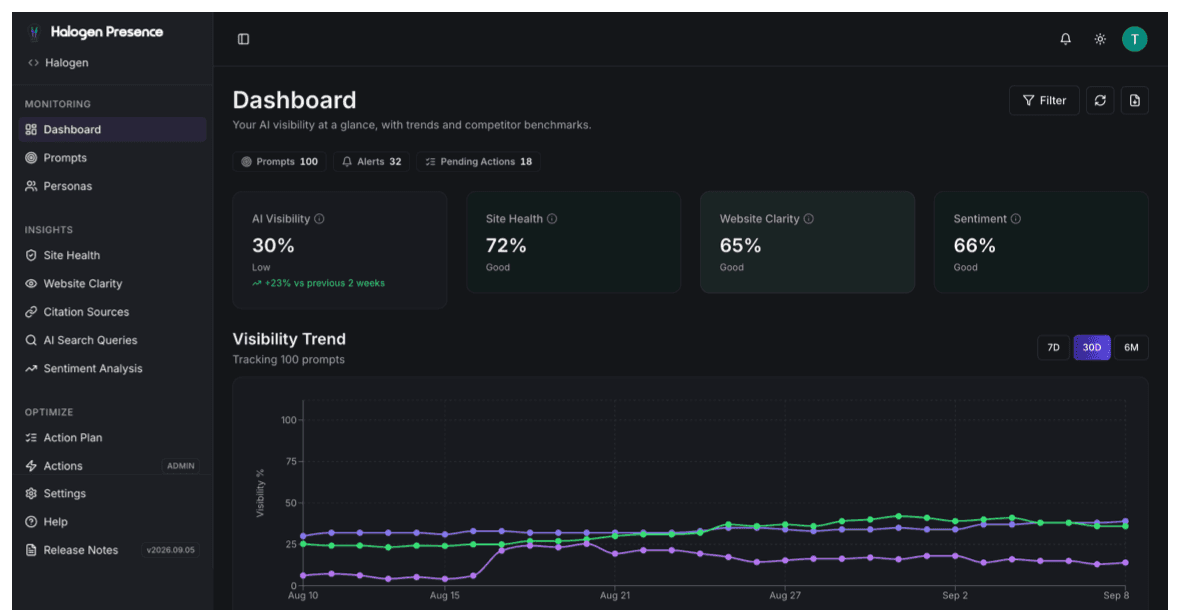
The dashboard is the first thing you see when you log into Halogen Presence, and it's built to answer one question: are you showing up when your buyers ask AI assistants about your category? Everything else on the page exists to explain that one number.
The score at the top isn't a vanity metric
AI Visibility is the percentage of your tracked prompts where Claude, ChatGPT, or Gemini named your brand in the answer. Nothing more mystical than that. If you're tracking 100 prompts and your brand showed up in 30 of the runs across all three platforms, you're at 30%.
Three smaller scores sit next to it: Site Health, Website Clarity, Sentiment. Each one feeds the main score indirectly rather than being averaged into it. Site Health measures whether AI crawlers can actually find and parse your content. Website Clarity measures whether a visitor (human or AI) can tell what you do within the first few seconds on your homepage. Sentiment measures how favorably AI models talk about you when they do mention you. If site health is high but visibility is low, the problem is usually what you've written, not whether AI crawlers can reach it. Flip it around, though: low site health with decent visibility anyway usually points to something technical, like crawler access, page speed, or structured data.
Each score carries a plain-language label next to the number (Low, Moderate, Good), so you don't have to memorize what a given percentage means. On the sentiment side specifically, the bands are explicit: 0–39 is "Needs Work," 40–69 is "Moderate," 70–100 is "Strong." The other scores use the same idea without publishing the exact cutoffs, because what counts as "good" site health varies more by industry than sentiment does.
The trend chart is where the real signal lives
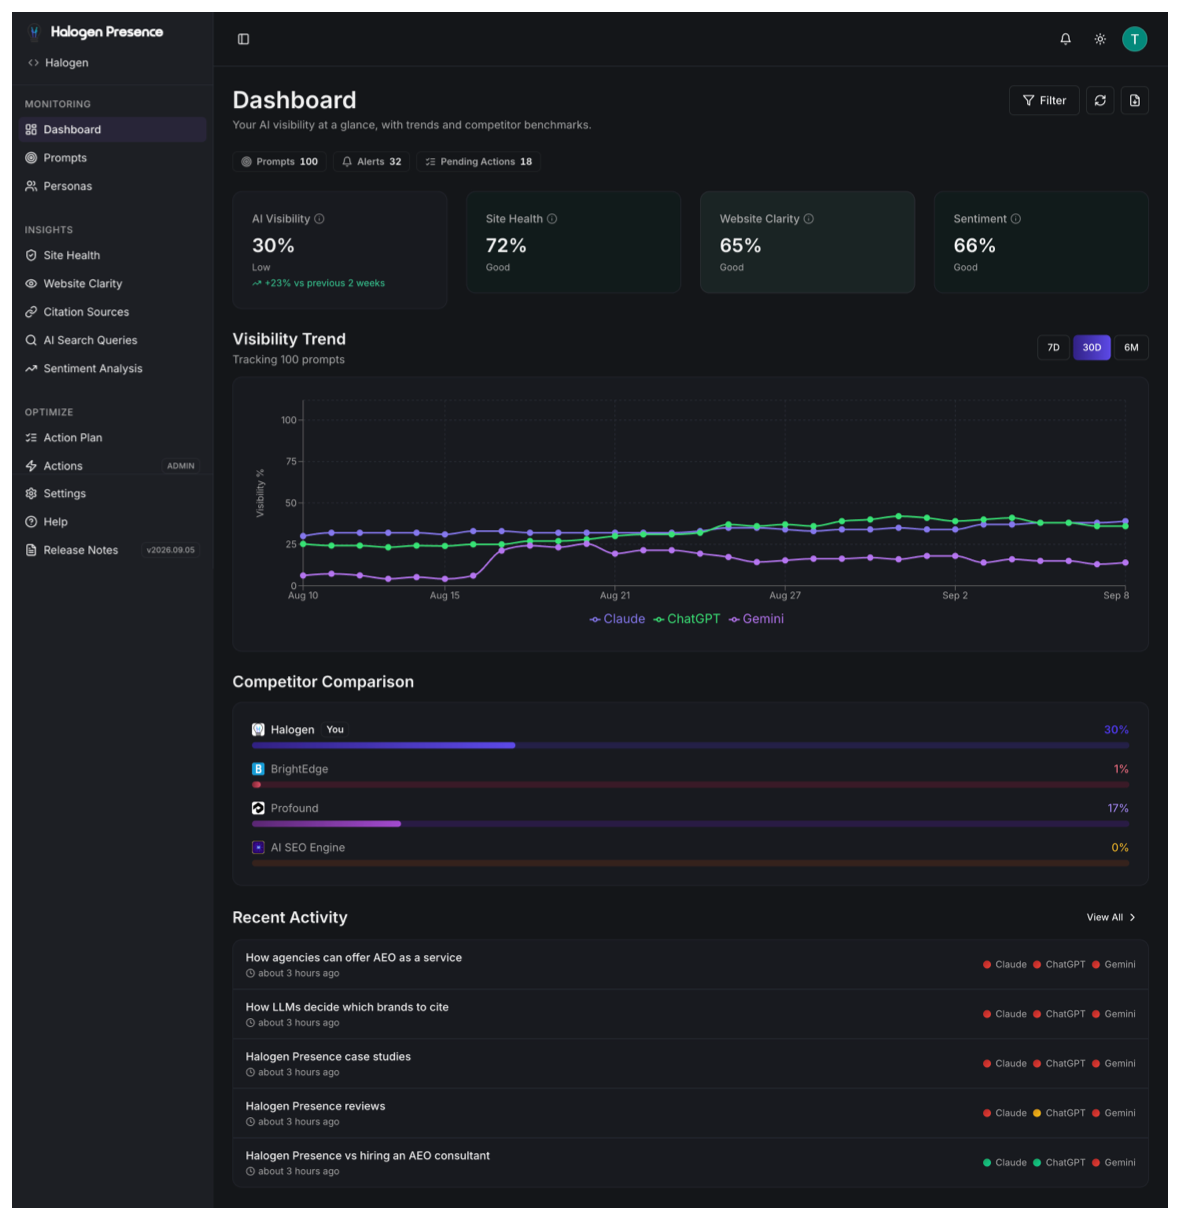
A single visibility number is a snapshot. The trend chart underneath it is the part worth actually reading, because it's broken out by platform. Claude, ChatGPT, and Gemini get separate lines instead of being blended into one average. That separation matters more than it looks like it should.
The three platforms don't move together. A crawler access change, a new competitor's content push, or a model update on just one provider's side will show up as one line moving while the other two stay flat. If you only looked at a blended score, you'd see a small overall shift and might miss that one platform swung hard in either direction. Check the 30-day and 6-month views before drawing conclusions from a short window. A single bad week on one platform is common, and usually not worth acting on by itself.
Competitor Comparison is a leaderboard, not a report card
Below the trend chart, the Competitor Comparison section shows your visibility percentage next to the same number for each named competitor, on the same prompts. This is the fastest way to tell whether a low score is a you problem or a category problem. If nobody in your comparison set breaks 20%, AI models mostly aren't citing anyone in your category yet, and the opportunity is different than if a competitor is sitting at 60% while you're at 5%.
You pick who's in this list. Add the competitors your buyers actually compare you against, not the biggest logos in your space. A well-known competitor who isn't actually cited in AI answers tells you less than a smaller, better-optimized one who is.
Recent Activity is your early-warning feed
The activity list at the bottom shows the individual prompt checks as they run, tagged with which platforms responded. It's not meant to be read top to bottom every day. It's there so that when your score moves, you can find the specific prompt and platform that moved it instead of guessing.
What to check first
Start with the trend chart, not the top-line number. A single score tells you where you stand today. The trend chart tells you which platform is actually moving, and in which direction. That's the part worth acting on. From there, your action plan turns whatever you find into specific, ranked fixes instead of leaving you to interpret the dashboard on your own.
If you're setting up competitor tracking for the first time, see how to choose and set up competitors. For the full methodology behind how sentiment and citation scores get calculated, see how we calculate scores.